16 Aug 2026
Demographic Lines in Poker Adoption: Home Devices and Casino Venues

Demographic data on poker participation continues to reveal distinct patterns between digital platforms and physical casino environments, with various forms of the game attracting different player groups based on age, location, and prior experience. Studies from industry observers indicate that online formats such as Texas Hold'em and Pot-Limit Omaha draw larger shares of participants under 35, while casino floor games often see higher engagement from those over 45 who prefer structured table settings and in-person interaction.
Age and Platform Preferences
Research compiled by the American Gaming Association shows younger cohorts favor rapid online sessions that allow multiple tables simultaneously, whereas older groups tend toward slower-paced live games where social elements play a larger role; this divide has held steady through mid-2026, with August figures from several state regulators reflecting continued growth in mobile poker traffic among the 18-34 segment. Data indicates that 62 percent of online poker participants fall into the under-35 category, compared to just 28 percent on casino floors, where the median age sits closer to 48 according to aggregated venue reports.
Those who track participation trends note that students and early-career professionals often begin with free-to-play or low-stakes home apps before migrating to real-money digital tables, creating a pipeline that feeds into casino visits only after several years of experience. In contrast, retirees and mid-career professionals who started at brick-and-mortar venues during earlier decades maintain loyalty to live tournaments and cash games.
Geographic and Format Variations
Regional differences further shape adoption rates, with urban centers in North America reporting higher online uptake while suburban and rural areas show stronger casino-floor retention for games like Seven-Card Stud and traditional Hold'em. Australian government gaming statistics reveal similar splits, where remote play accounts for nearly 55 percent of recorded poker activity in metropolitan postcodes yet drops below 30 percent outside major cities. Observers point out that these patterns align with broadband access and commute times to licensed venues rather than inherent game preferences alone.
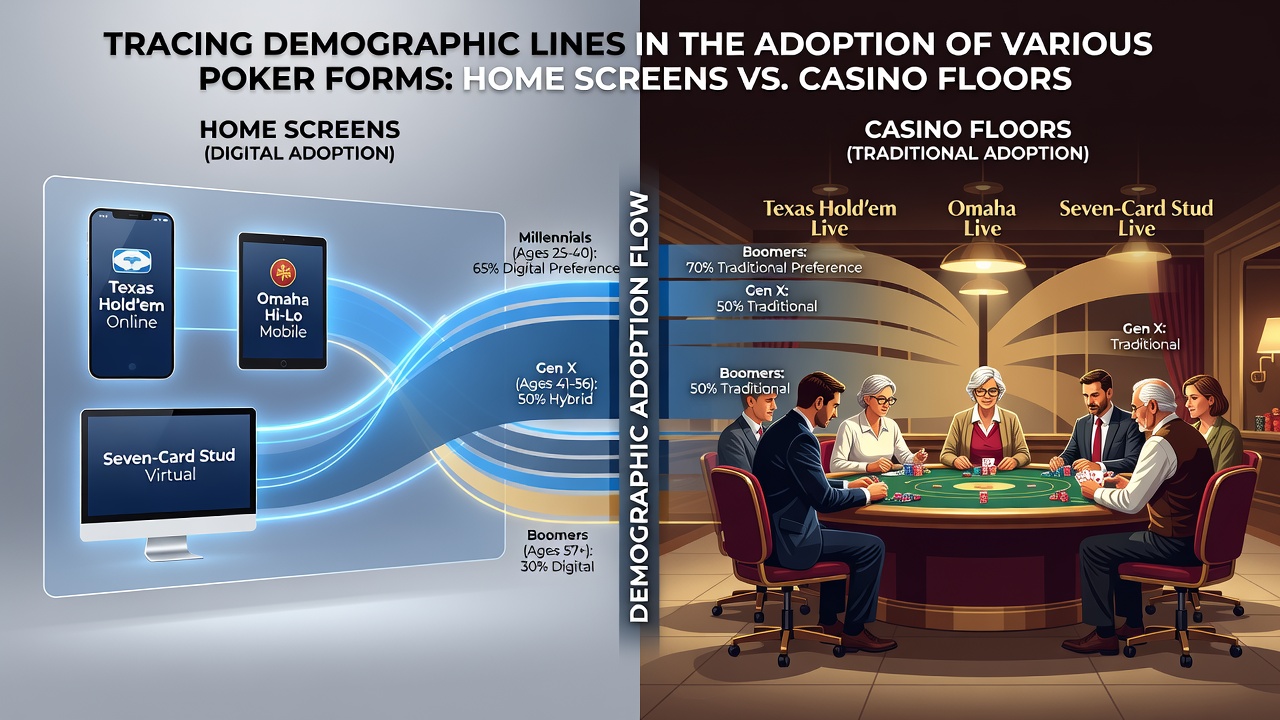
Format adoption also tracks closely with experience levels. Pot-Limit Omaha has gained traction primarily among online users aged 25-40 who appreciate its mathematical complexity and larger pot potential, while casino tables continue to host more No-Limit Hold'em events that accommodate mixed-skill groups. Canadian provincial data from 2025-2026 illustrates this split, with Omaha tournaments comprising 18 percent of online volume versus 7 percent of live casino events during the same period.
Income, Education, and Access Factors
Income brackets influence platform choice as well. Higher-earning professionals often split time between both environments, using home screens for practice and quick sessions while reserving casino visits for larger buy-in tournaments. Lower-to-middle income participants show stronger concentration on digital platforms due to lower travel costs and flexible session lengths. Educational attainment correlates with variant selection, as those with college degrees appear more frequently in Omaha and mixed-game formats according to multiple player surveys conducted by academic researchers.
Employment status adds another layer. Shift workers and those with irregular schedules gravitate toward 24-hour online rooms, while salaried employees with standard hours populate weekend casino floors more consistently. These behavioral distinctions have remained stable even as overall poker participation held steady through the first half of 2026.
Conclusion
Patterns traced across demographic categories demonstrate that poker form adoption between home screens and casino floors follows predictable lines tied to age, geography, experience, and daily routines. Continued monitoring by regulatory bodies and industry groups will clarify whether these lines shift as new variants and technologies emerge in coming years.